Hilbert Transform - Instantaneous Trendline (HT_TRENDLINE)
Summary
Ehlers' Hilbert Transform Instantaneous Trendline: a smoothed, low-lag overlay whose averaging window adapts to the dominant cycle period measured via Hilbert-transform quadrature (I/Q) analysis of price.
Chart
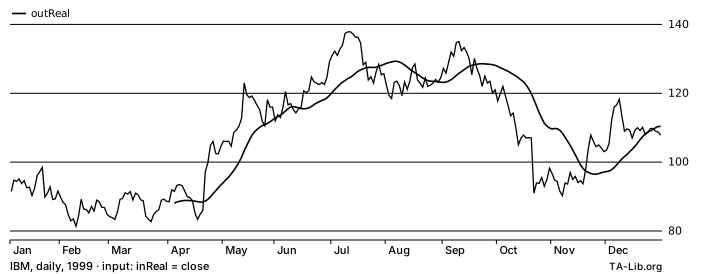
Chart metadata i
Outputs
outReal:line
Inputs
inReal— Source price series
Outputs
outReal— Instantaneous trendline value
Properties
Numerical Stability: Initial Unstable Period
| ✅ Overlap Input i |
| ☐ Independent Y-Axis |
| ☐ Candlestick |
| ☐ Display Shift |
| ☐ Can Output NaN or ±Inf |
| ☐ Identity at Period 1 |
| ✅ Uses Transcendental i |
| ☐ Input Must Be Positive |
Example
C
#include <stdio.h>
#include <ta_libc.h>

int n = 252;
double series[252]; /* your data, oldest first */
double out[252];
int outBegIdx, outNBElement;

TA_Initialize();
TA_HT_TRENDLINE( 0, n - 1, series, &outBegIdx, &outNBElement, out );
printf( "%d values from bar %d; last out = %f\n", outNBElement, outBegIdx, out[outNBElement - 1] );
Rust
use ta_lib::Core;

let series = vec![0.0; 252]; // your data, oldest first
let mut out = vec![0.0; 252];

let core = Core::new();
let range = core.ht_trendline(0, series.len() - 1, &series, &mut out)?;
println!("{} values from bar {}; last out = {}", range.count, range.beg_idx, out[range.count - 1]);
Java
import io.github.talib.Core;
import io.github.talib.OutRange;

double[] series = new double[252]; // your data, oldest first
double[] out = new double[252];

Core core = Core.DEFAULT;
OutRange r = core.htTrendline(0, series.length - 1, series, out);
System.out.println(r.count() + " values from bar " + r.begIdx() + "; last out = " + out[r.count() - 1]);
C#
using System;
using TALib;

var series = new double[252]; // your data, oldest first
var outReal = new double[252];

var core = Core.Default;
OutRange r = core.HtTrendline(0, series.Length - 1, series, outReal);
Console.WriteLine($"{r.Count} values from bar {r.BegIdx}; last outReal = {outReal[r.Count - 1]}");
TypeScript
import { htTrendline } from 'ta-lib';

const series = new Float64Array(252); // your data, oldest first

const { begIdx, values } = htTrendline(series);
console.log(values.length + ' values from bar ' + begIdx + '; last values = ' + values[values.length - 1]);
Implementation
Added in 0.4.0.
TA-Lib Definition: ht_trendline.c · ht_trendline.yaml
| Native | File |
|---|---|
| C | ta_HT_TRENDLINE.c |
| Rust | ht_trendline.rs |
| Java | Core_HT_TRENDLINE.java |
| C# | Core_HT_TRENDLINE.cs |
| TypeScript | htTrendline.ts |
Python: talib.HT_TRENDLINE, see ta-lib-python.
TA-Lib is also available for R and more using a wrapper.
Aliases
Hilbert Transform Instantaneous Trendline, Instantaneous Trendline
See Also
HT_DCPERIOD · HT_PHASOR · MAMA · WMA
References
- John F. Ehlers, Rocket Science for Traders: Digital Signal Processing Applications, John Wiley & Sons (ISBN 0471405671)