Correlation Trend Indicator (CTI)
Summary
John F. Ehlers' Correlation Trend Indicator: the Pearson correlation of the last optInTimePeriod closes against a straight line of positive slope. Bounded in -1..+1 by construction — +1 is a perfectly linear uptrend, -1 a perfectly linear downtrend, 0 no linear trend. Trend strength and direction in one bounded number, with no smoothing, no recursion and no filter coefficients.
Arithmetically it is CORREL of the series against a ramp, with the ramp side collapsed to closed-form constants.
Chart
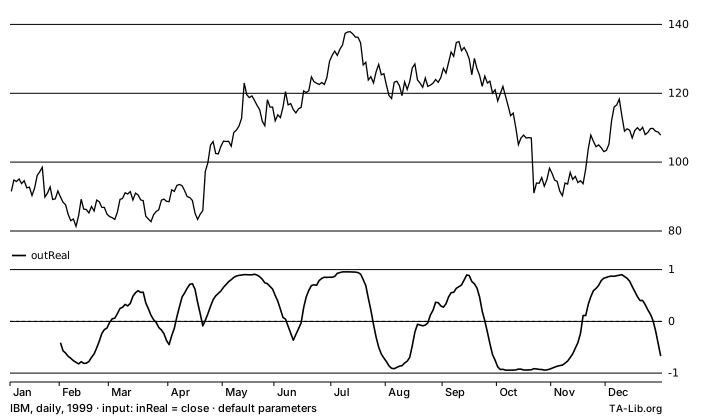
Chart metadata i
Outputs
outReal:line·zero·positive·negative
Formula
With n = optInTimePeriod, x the window's closes and y a straight line rising with time:
CTI = ( n·Σxy − Σx·Σy ) / sqrt( ( n·Σx² − (Σx)² ) · ( n·Σy² − (Σy)² ) ), or 0 when the window is flat
A rising series therefore reads positive. The y side is data-independent and collapses exactly: n·Σy² − (Σy)² = n²(n²−1)/12.
Notes
- A flat window returns exactly
0.0rather than holding the previous value as the author's listing does; holding would make the function path-dependent. - The result is clamped into -1..+1, as
CORRELis: rounding in three sums can put a coefficient slightly outside its own range. optInTimePeriodstarts at 2, not 1: atn = 1the closed formn²(n²−1)/12is identically zero and every window is degenerate.
Inputs
inReal— The series to measure the trend of
Outputs
outReal— Correlation against the ramp, in -1..+1
Parameters
| Parameter | Type | Default | Accepted values | Description |
|---|---|---|---|---|
optInTimePeriod | integer | 20 | 2–100000 | Number of trailing values correlated against the ramp |
Properties
Numerical Stability: Start-Independent
| ☐ Overlap Input |
| ✅ Independent Y-Axis i |
| ☐ Candlestick |
| ☐ Display Shift |
| ☐ Can Output NaN or ±Inf |
| ☐ Identity at Period 1 |
| ☐ Uses Transcendental |
| ☐ Input Must Be Positive |
Example
#include <stdio.h>
#include <ta_libc.h>

int n = 252;
double series[252]; /* your data, oldest first */
double out[252];
int outBegIdx, outNBElement;

TA_Initialize();
TA_CTI( 0, n - 1, series, 20, &outBegIdx, &outNBElement, out );
printf( "%d values from bar %d; last out = %f\n", outNBElement, outBegIdx, out[outNBElement - 1] );use ta_lib::Core;
let series = vec![0.0; 252]; // your data, oldest first
let mut out = vec![0.0; 252];
let core = Core::new();
let range = core.cti(0, series.len() - 1, &series, 20, &mut out)?;
println!("{} values from bar {}; last out = {}", range.count, range.beg_idx, out[range.count - 1]);import io.github.talib.Core;
import io.github.talib.OutRange;
double[] series = new double[252]; // your data, oldest first
double[] out = new double[252];
Core core = Core.DEFAULT;
OutRange r = core.cti(0, series.length - 1, series, 20, out);
System.out.println(r.count() + " values from bar " + r.begIdx() + "; last out = " + out[r.count() - 1]);using System;
using TALib;
var series = new double[252]; // your data, oldest first
var outReal = new double[252];
var core = Core.Default;
OutRange r = core.Cti(0, series.Length - 1, series, 20, outReal);
Console.WriteLine($"{r.Count} values from bar {r.BegIdx}; last outReal = {outReal[r.Count - 1]}");import { cti } from 'ta-lib';
const series = new Float64Array(252); // your data, oldest first
const { begIdx, values } = cti(series, { timePeriod: 20 });
console.log(values.length + ' values from bar ' + begIdx + '; last values = ' + values[values.length - 1]);Implementation
Added in 0.8.3 (ta-lib-python 0.8.3).
TA-Lib Definition: cti.c · cti.yaml
| Native | File |
|---|---|
| C | ta_CTI.c |
| Rust | cti.rs |
| Java | Core_CTI.java |
| C# | Core_CTI.cs |
| TypeScript | cti.ts |
Python: talib.CTI (ta-lib-python 0.8.3 or later), see ta-lib-python.
TA-Lib is also available for R and more using a wrapper.
Aliases
Correlation Trend Indicator, Ehlers Correlation Trend Indicator, Correlation Trend
See Also
CORREL · LINEARREG_SLOPE · VHF
References
- John F. Ehlers, "Correlation As A Trend Indicator", Technical Analysis of Stocks & Commodities, V.38:5 (May 2020), Code Listing 1, author's PDF